Compressing AWS S3 logs after getting HackerNewsed
Table of contents
Abstract
One of my previous articles about Firecracker and RPI got posted on HN, and I just realized that many months ago, I enabled logging on the S3 bucket hosting this content. I quickly wanted to peek into the stats, and when I discovered that Athena could not process compressed S3 logs.
I was already working on a larger AWS codebase in F#, so I decided to write a tool that can download the raw logs from S3 and merge all the small files, convert it to Parquet and upload those back.
C# has excellent AWS libraries, and after a bit of wrapping, those are suitable for F# dvelopment.
Processing log files
First, I just created types so I can handle error on the caller side:
// S3ReadError can be used for other read oprations not just for Get
type S3ReadError =
  | NotFound of key: string
  | S3ReadPermissionDenied of keyOrPrefix: string
  | S3ReadException of keyOrPrefix: string * isRecoverable: bool * httpStatus: int option * ex: Exception option

type S3GetBytesSuccess = S3GetBytesSuccess of key: string * value: byte []

type S3GetBytesReturn = Result<S3GetBytesSuccess, S3ReadError>
AWS already makes you use async code, but it is easy to turn that into sync calls if you do not want to have async in your code. Bob already pointed out why async as we use it in many languages is problematic.
//
// READ - GET - ASYNC
//

member this.GetS3ObjectBytesAsync (bucket: string) (key: string): Async<S3GetBytesReturn> =
async {
  try
    let! ct = Async.CancellationToken

    let request =
    GetObjectRequest(BucketName = bucket, Key = key)

    let task = awsS3Client.GetObjectAsync(request, ct)

    let! result = task |> Async.AwaitTask

    match result.HttpStatusCode with
    | HttpStatusCode.OK -> return Ok(S3GetBytesSuccess(key, (readAllBytes result.ResponseStream)))
    | httpStatus -> return Error(S3ReadException(key, false, (Some(int httpStatus)), None))

  with ex -> return Error(handleReadException key ex)
}


//
// READ - GET - SYNC
//

member this.GetS3ObjectBytes (bucket: string) (key: string): S3GetBytesReturn =
this.GetS3ObjectBytesAsync bucket key
|> Async.RunSynchronously
With such functions, it is straightforward to write parallel code, where we can control parallelism. This is the first version. I use a global state variable, which not very idiomatic in functional programming, but since this is a simple linear execution with single points of mutations, it does not matter. I quite often see functional programming going to the extreme and declaring that all mutations are evil. This is why F# is one of the most productive languages out there because it lets me do mutations when I need those.
let doDownloadFiles (fileStates: Dictionary<string, FileState>) (s3v2: S3v2) (localFolder: string) (bucket: string) =

  let asynTaskList =
    fileStates
    |> Seq.map (fun fileEntry ->
        async {
          match (downloadFile s3v2 localFolder bucket fileEntry.Key) with
          | Ok _x -> return (fileEntry.Key, Downloaded)
          | Error err -> return (fileEntry.Key, (FileStateError err))
        })

  Async.Parallel(asynTaskList, 10)
  |> Async.RunSynchronously
  |> Seq.iter (fun (k, v) -> fileStates.[k] <- v)
The complete code is here:
Visualization
After I could download, process the text files, and upload the Parquet files, I was looking to visualize the data. I am a long-time fan of Plotly for many reasons, and they have a project called Dash that I wanted to try for a long time.
There must be a bit of reshuffling of data for processing weblogs, maybe some aggregation in many cases. For that, Python's Pandas library is an ok choice. I am not saying it is excellent because there are many ways of doing the same thing, the error messages are not clear, and after working with it for 5 years, I still could not use it without reading its documentation and StackOverflow, often both.
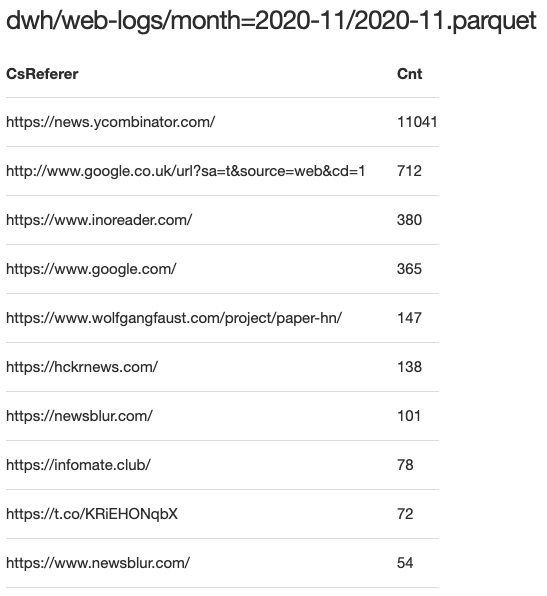
Referers
The first metric I was curious about is top referrers. The "null" values must be removed, and then we can then use Pandas and groupby to get the top 15 referrers.
df_ref = df[df['CsReferer'] != '-']
filter_self = df_ref['CsReferer'].str.contains('dev\\.l1x\\.be')
df_ref = df_ref[~filter_self]
top_ref = df_ref.groupby(['CsReferer'])['CsReferer'].count().nlargest(15).to_frame()
top_ref.rename(columns={'CsReferer':'Cnt'}, errors='raise', inplace=True)
top_ref.reset_index(level=0, inplace=True)
We can display this with Dash / Plotly as a table.
def generate_table(dataframe, max_rows=15):
  return html.Table([
    html.Thead(
      html.Tr([html.Th(col) for col in dataframe.columns])
    ),
    html.Tbody([
      html.Tr([
          html.Td(dataframe.iloc[i][col]) for col in dataframe.columns
      ]) for i in range(min(len(dataframe), max_rows))
    ])
  ])

def generate_top_referes():
  idx = 0
  top_refs = []
  top_refs.append(html.H3('Top Referers'))
  for top_ref in get_top_referers(months_report):
    children = []
    children.append(html.H4(s3_file_names[idx]))
    children.append(generate_table(top_ref))
    top_refs.append(html.Div(children, className='row'))
    idx += 1
This yields a simple table:
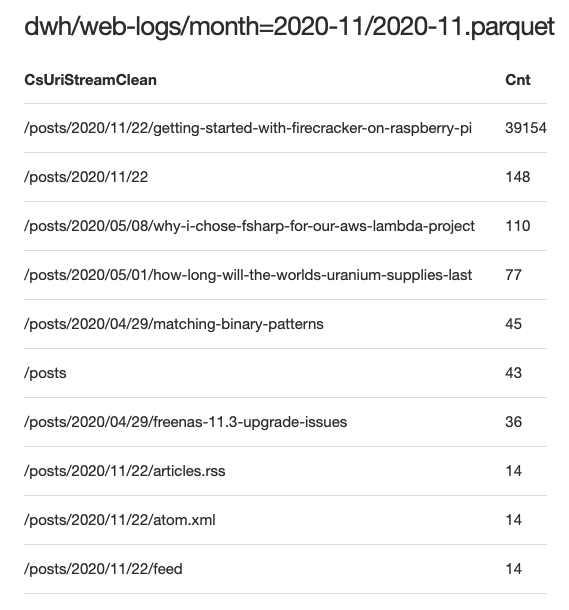
Top Posts
This metric is about the most visited posts. I had to remove the CSS, fonts, etc., urls.
def get_top_posts(months_report):
  top_urls = []
  for df in months_report:
    df = df[df['CsUriStreamClean'].str.contains('posts')].copy()
    top_url = df.groupby(['CsUriStreamClean'])['CsUriStreamClean'].count().nlargest(10).to_frame()
    top_url.rename(columns={'CsUriStreamClean':'Cnt'}, errors='raise', inplace=True)
    top_url.reset_index(level=0, inplace=True)
    top_urls.append(top_url)
  return top_urls
def generate_top_posts():
  idx = 0
  top_posts = []
  top_posts.append(html.H3('Top Posts'))
  for top_url in get_top_posts(months_report):
    children = []
    children.append(html.H4(s3_file_names[idx]))
    children.append(generate_table(top_url))
    top_posts.append(html.Div(children, className='row'))
    idx += 1
And it looks like this:
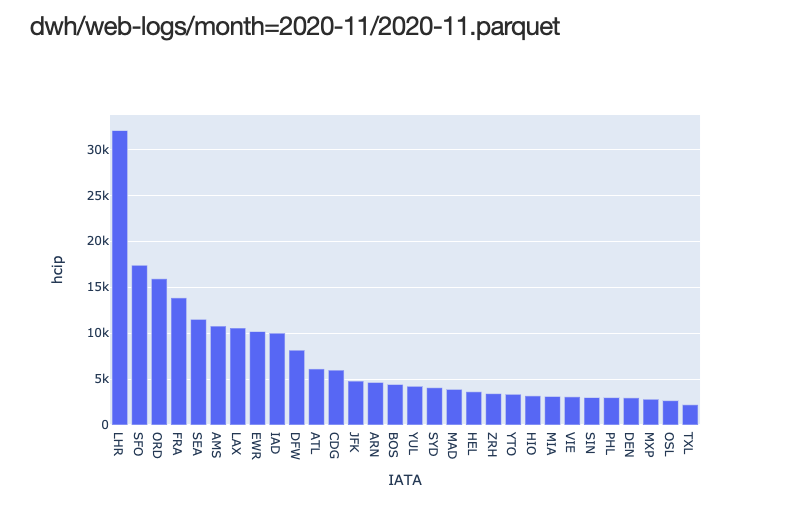
Top IATAs
I was also curious a bit about where the readers are from. AWS uses IATA code for naming their pops. This is easy to visualize:
def get_iata_codes(months_report):
  top_iata = []
  for df in months_report:
    data = df.groupby(['IATA'])['hcip'].count().nlargest(30).to_frame()
    fig = px.bar(data, x=data.index, y=data.hcip)
    top_iata.append(fig)
  return top_iata

def generate_top_iata():
  idx = 0
  top_iatas = []
  top_iatas.append(html.H3('Top IATAs'))
  for top_iata in get_iata_codes(months_report):
    children = []
    children.append(html.H4(s3_file_names[idx]))
    children.append(dcc.Graph(
        id='Top IATA codes where readers are {}'.format(idx),
        figure=top_iata
    ))
    top_iatas.append(html.Div(children, className='row'))
    idx += 1
Using a simple bar chart:
Full code is here.
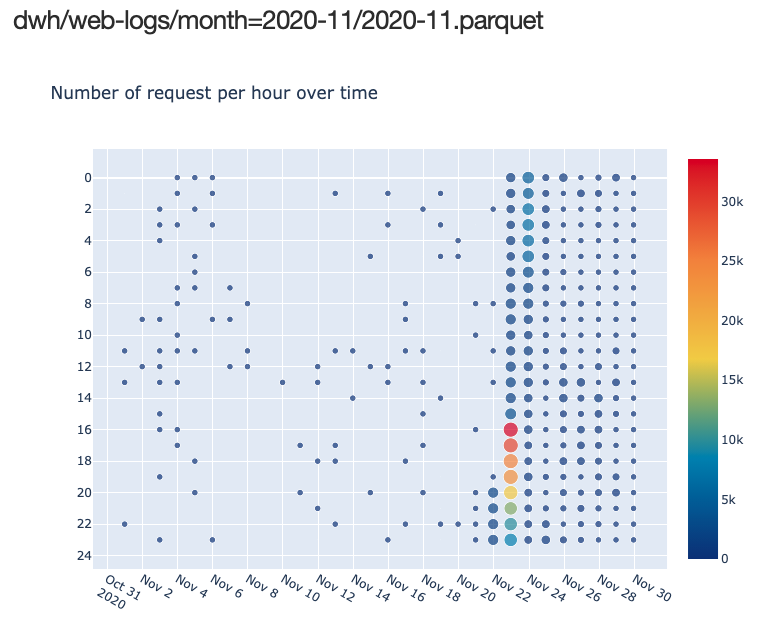
Hit distribution over time
For this metric, it would be great to use a heatmap. Luckily Plotly has a highly customizable heatmap that is easy to use.
def visitor_heatmap(df, scale='lin'):

  dfa = convert_to_time_indexed(generate_aggregates(df, ['day', 'hour'], 'ScStatus'), 'day')

  size_lin = dfa.Cnt.values
  size_log_2 = np.log(dfa.Cnt.values) / np.log(2)

  size = size_lin if scale=='lin' else size_log_2

  fig = go.Figure(
    data=go.Scattergl(
      x=dfa.index,
      y=dfa['hour'],
      mode='markers',
      marker=dict(
        color=dfa.Cnt,
        colorscale = 'portland',
        line_width=1,
        size=size,
        showscale=True,
        sizemin=3
      )
    )
  )

  fig.update_layout(
    height=600,
    title_text='Number of request per hour over time',
    yaxis_nticks=24,
    xaxis_nticks=31
  )

  fig.update_yaxes(autorange="reversed")
  return fig


def get_visiting_times(months_report):
  times = []
  for df in months_report:
    fig = visitor_heatmap(df, 'log')
    times.append(fig)
  return times

def generate_visting_times():
  idx = 0
  times = []
  times.append(html.H3('Visiting Times'))
  for time_fig in get_visiting_times(months_report):
    children = []
    children.append(html.H4(s3_file_names[idx]))
    children.append(dcc.Graph(
        id='Hit distribution over time {}'.format(idx),
        figure=time_fig
    ))
    times.append(html.Div(children, className='row'))
    idx += 1
Full code is here.